Understanding the Dashboard
The Dashboard is your main control center. Here's what you'll see:
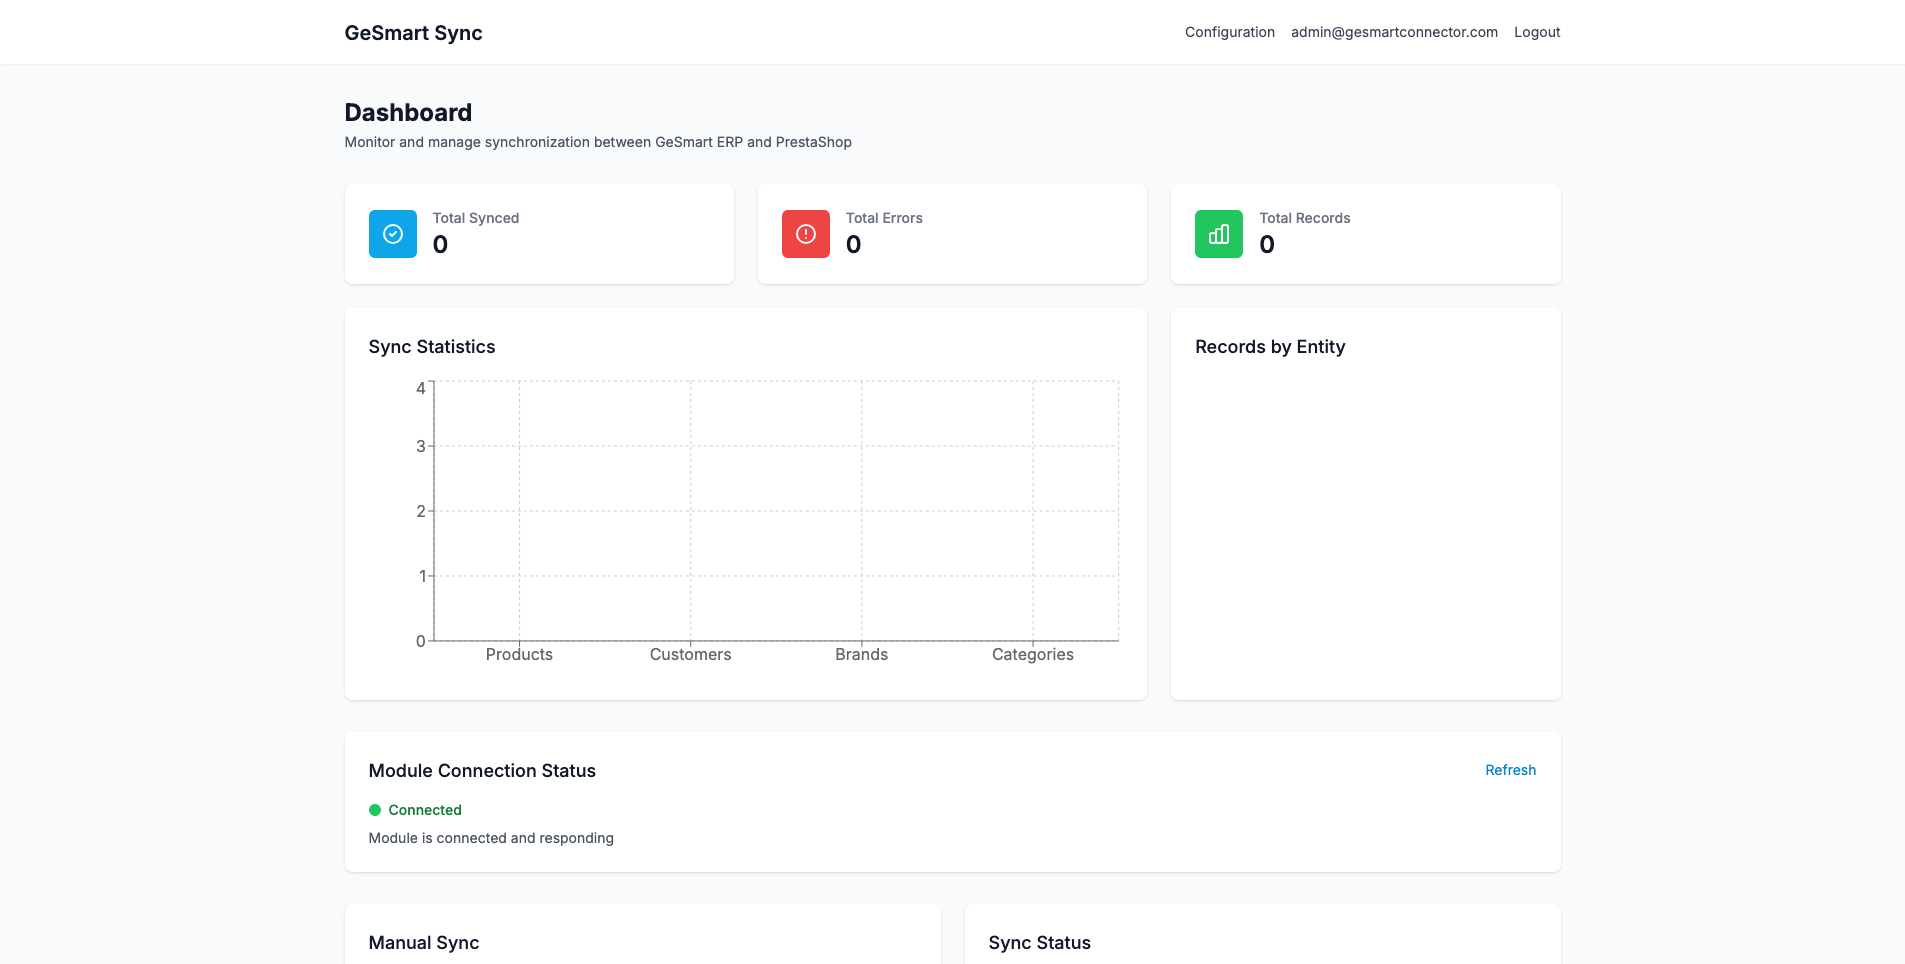
1. Sync Statistics Panel (Top)
Shows at-a-glance information:
- Total items synced today
- Success rate percentage
- Number of errors
- Last sync times for each entity type
2. Module Connection Status
Shows whether the application can communicate with:
- ✅ GeSmart ERP API
- ✅ PrestaShop Module
Green checkmarks = Connected and working
Red X marks = Connection issue (check configuration)
3. Manual Sync Controls (Left Panel)
Buttons to manually trigger syncs:
- Individual entity syncs (Products, Customers, Brands, Categories)
- "Sync All" option
- Incremental vs Full sync options
4. Sync Status Panel (Right Panel)
Shows the current status of each entity type:
- Last sync date and time
- Number of items synced
- Number of errors (if any)
- Sync configuration (incremental enabled/disabled)
5. Live Sync Monitor (Bottom)
Real-time monitoring when a sync is running:
- Active Syncs - Progress bars and current item being processed
- Live Sync Feed - Real-time list of items being synced
6. Recent Logs (Bottom)
History of recent sync operations and their results